CrystalClearWater
Environmental.
CrystalClearWater Environmental. What is complete, what is observed, what remains projected, and which decisions are still open.
Progress, value, and the decisions still ahead.
The dashboard combines delivery gates with operating measures, making incomplete work and client dependencies visible.
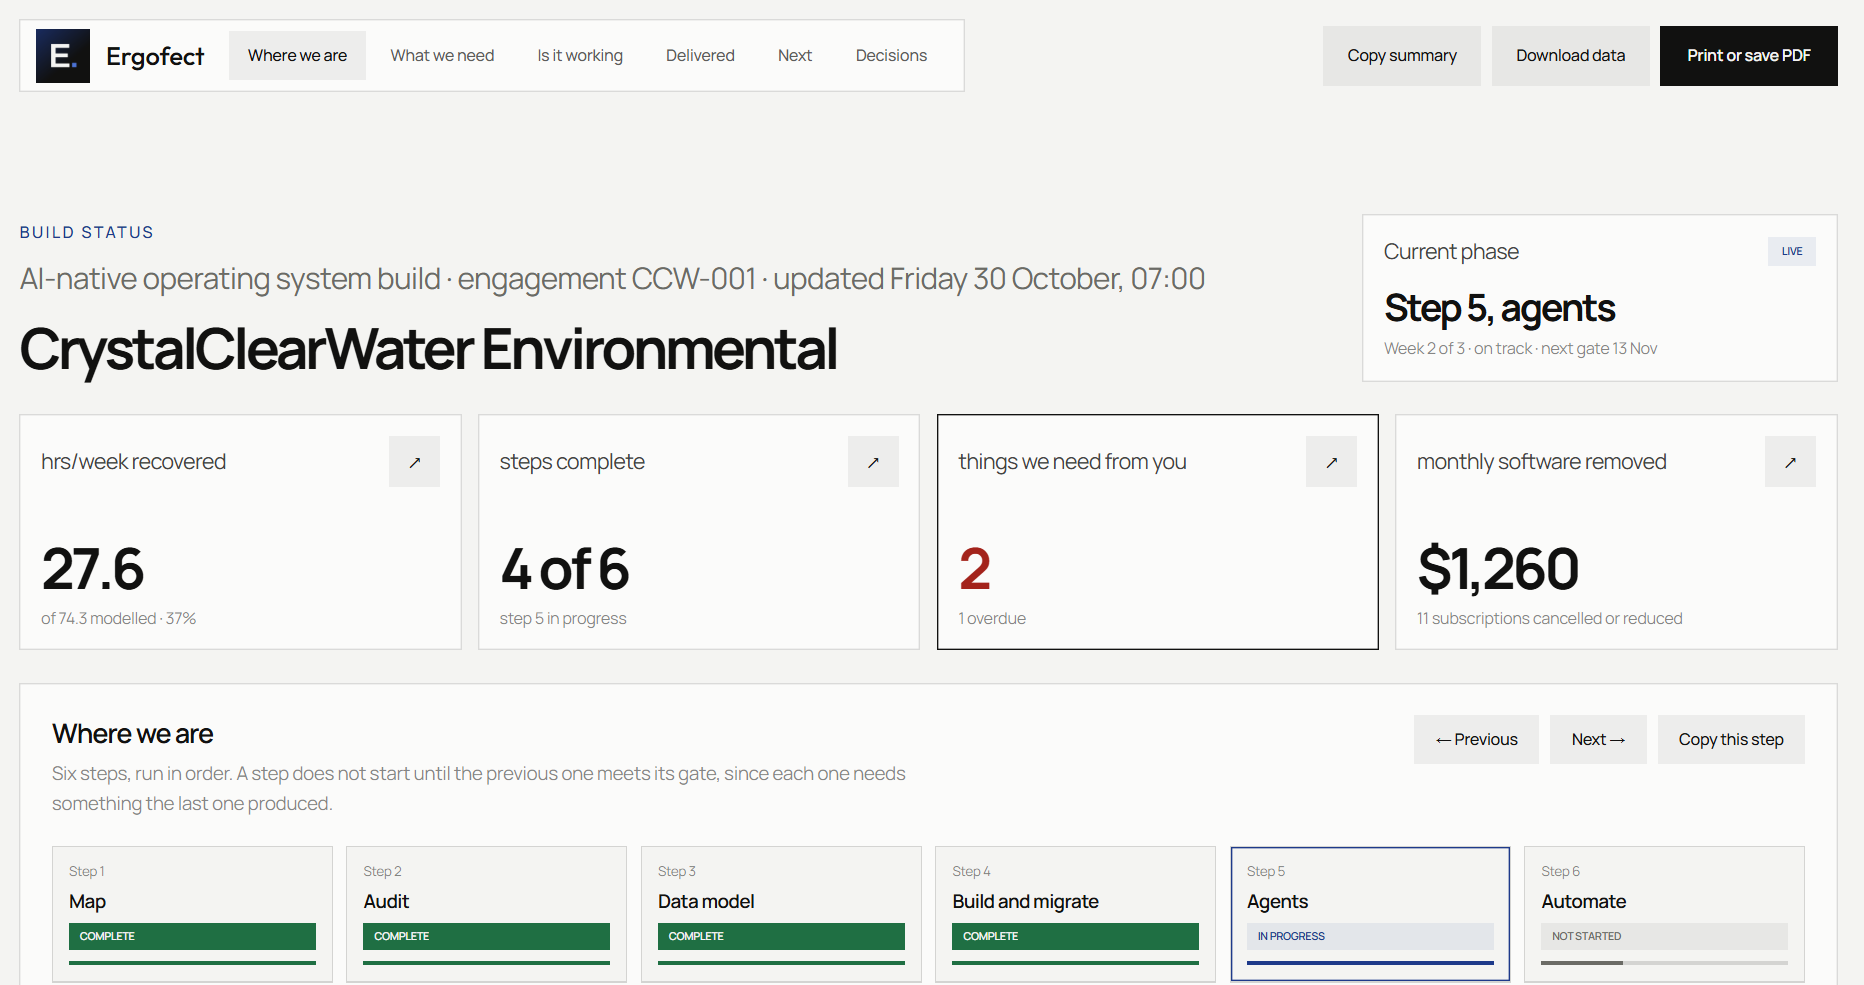
“Build and migrate” was specific to this engagement after the audit identified a required data move. Migration is not assumed for every Ergofect pilot.
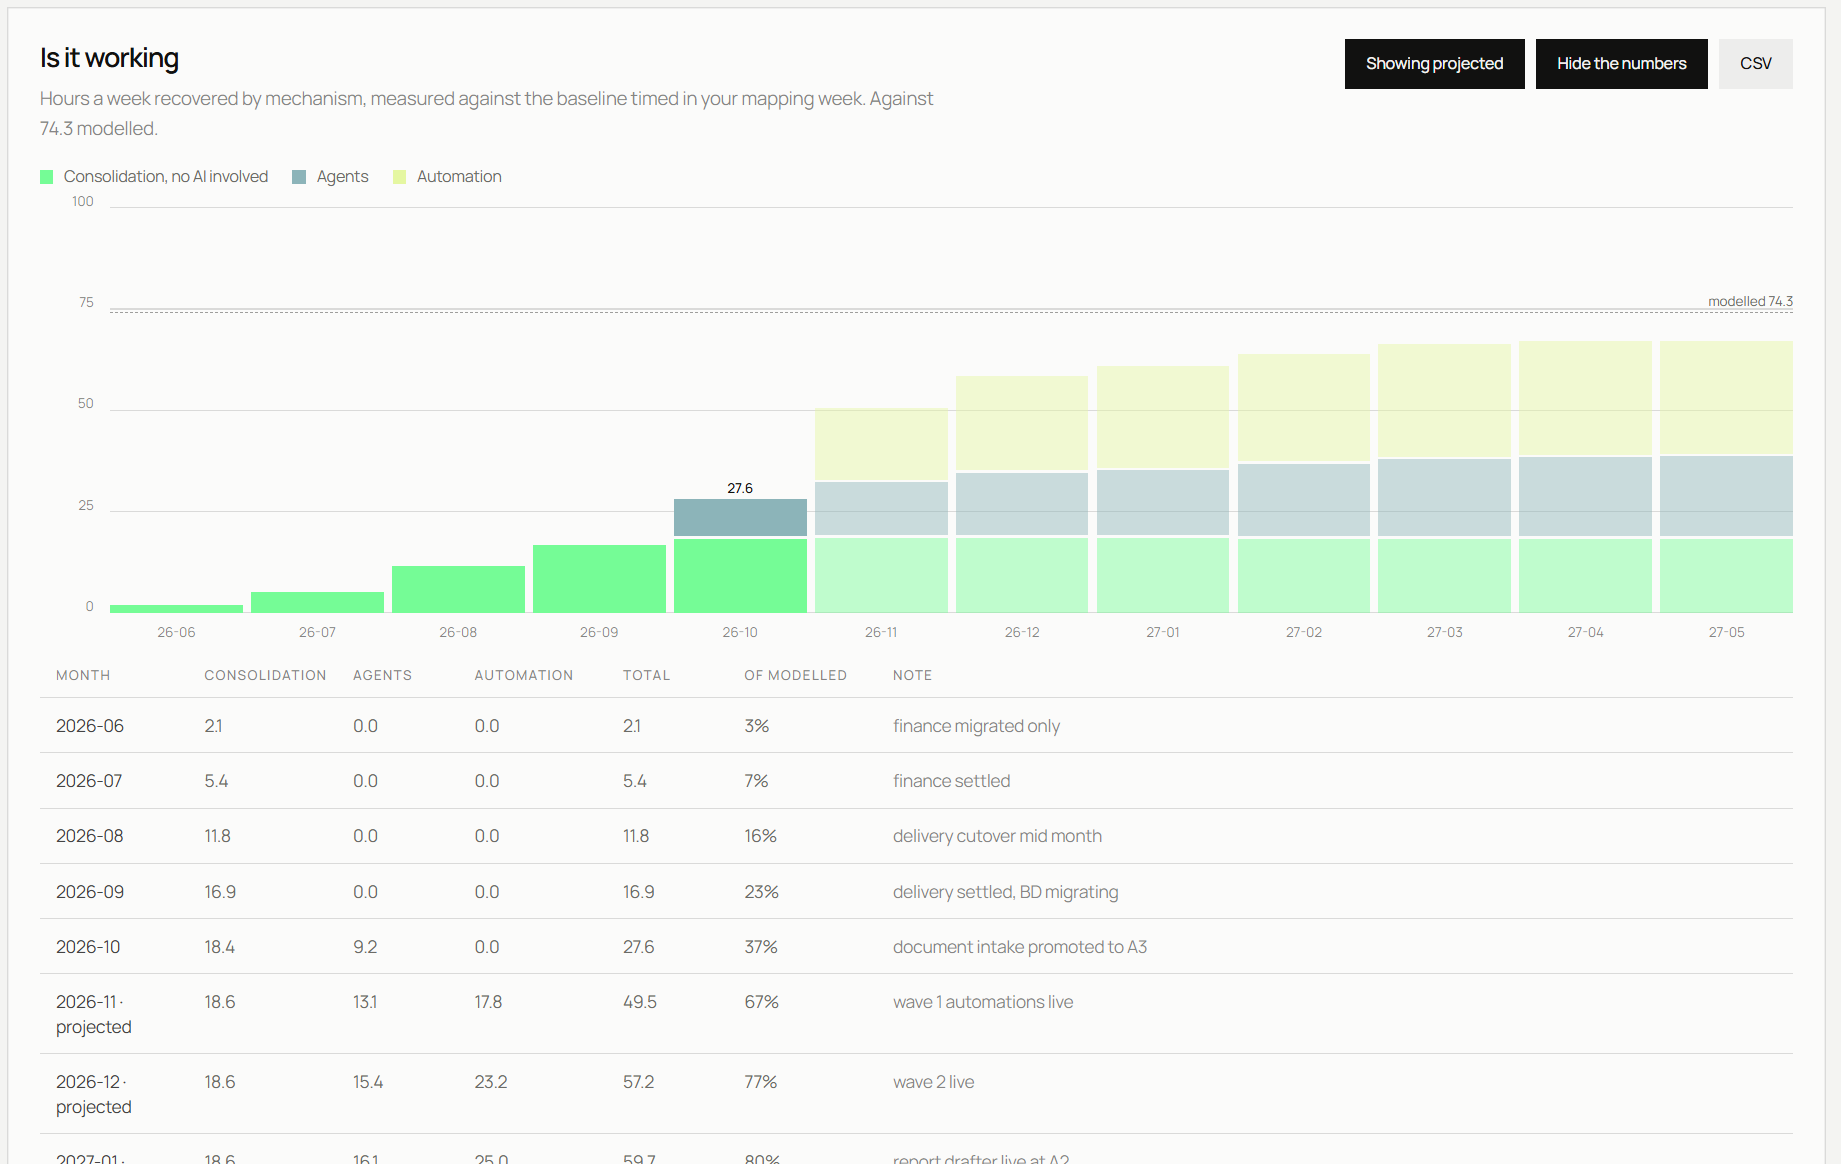
A forecast stays a forecast.
At the status point shown, the record contains 18.4 hours from consolidation and 9.2 from agents. Automation is still zero. Later bars remain visibly projected.
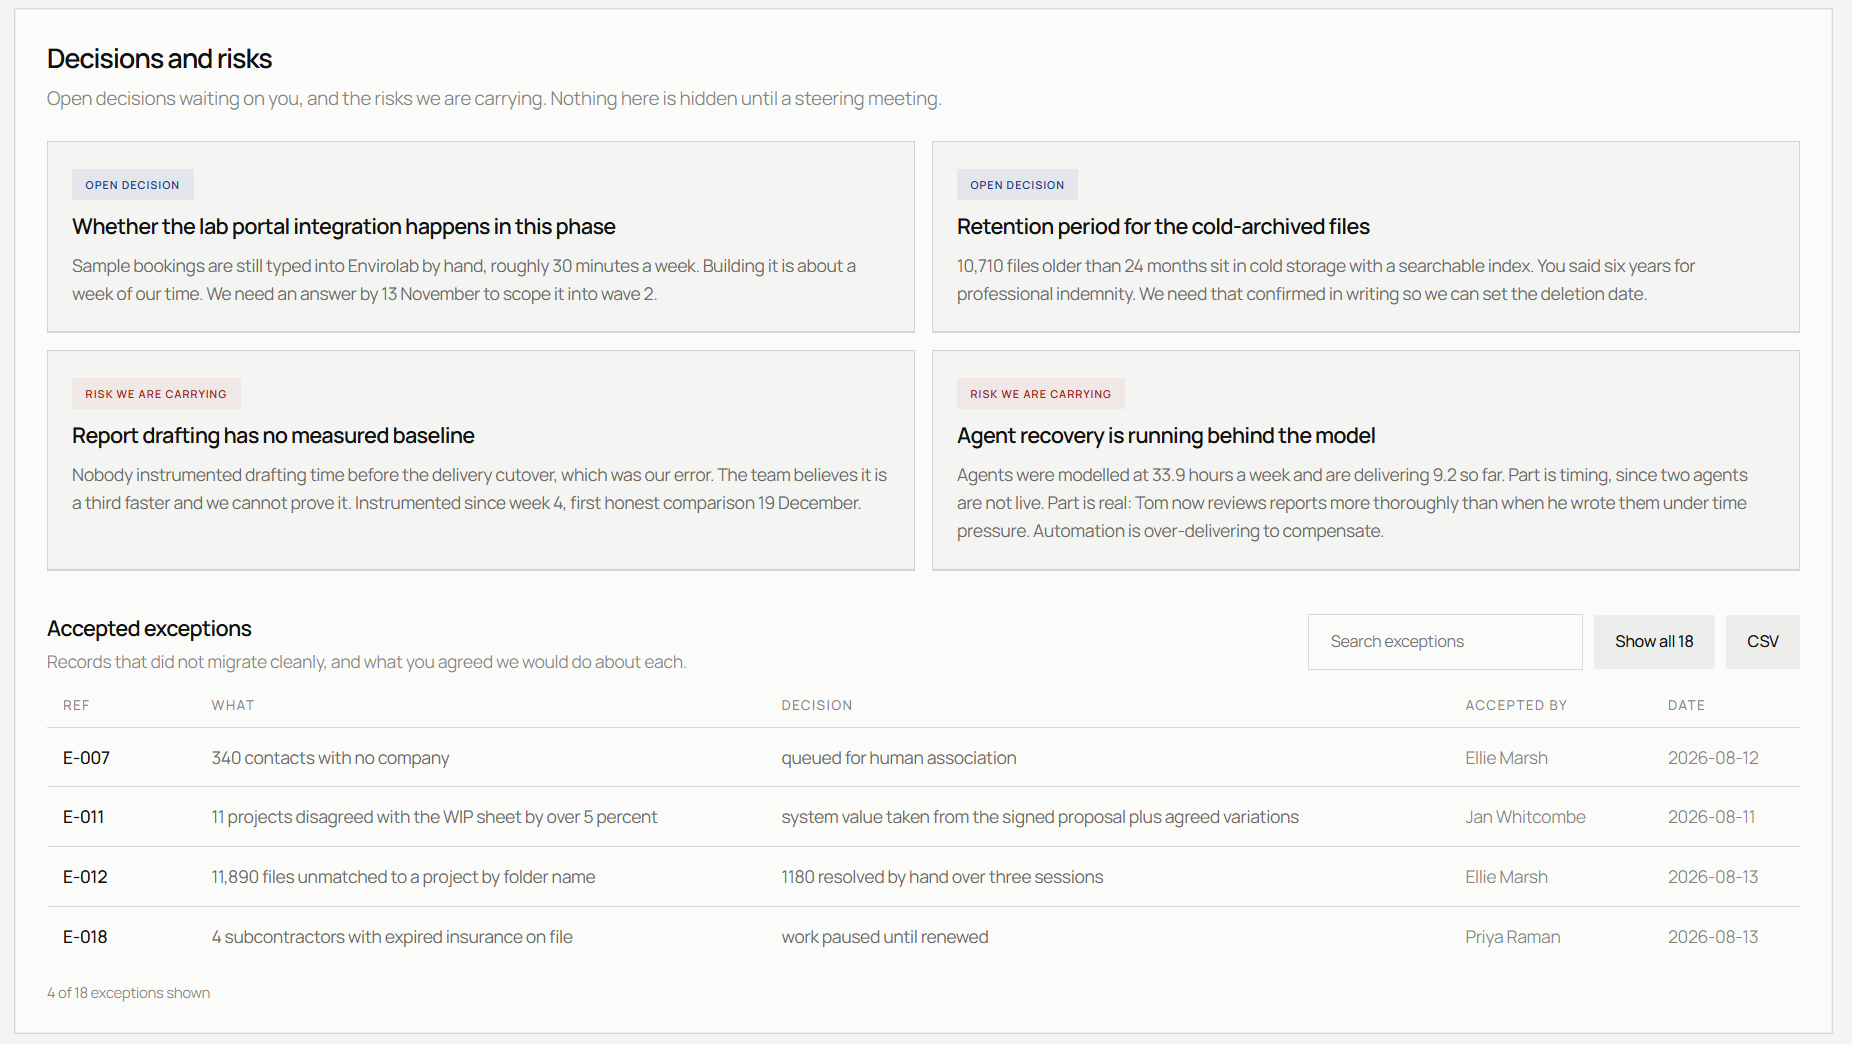
Decisions and risks stay in the record.
See where client input is blocking scope, where measurement is incomplete, and which imperfect records were accepted with a named decision.
Useful proof says where it stops.
What the record supports
- A dated operational snapshot of delivery progress
- Recorded recovery split by consolidation and agents
- Visible decisions, risks, exceptions, and owners
- A traceable distinction between observed and projected values
What it does not claim
- That the 74.3 modelled hours have been achieved
- That future projected bars are production results
- That every workstream had a complete before-state baseline
- That this client-specific migration is the default delivery model
Build your own
measurable record.
Bring us the bottleneck. We’ll review the work, the evidence, and the constraints before proposing a focused pilot.